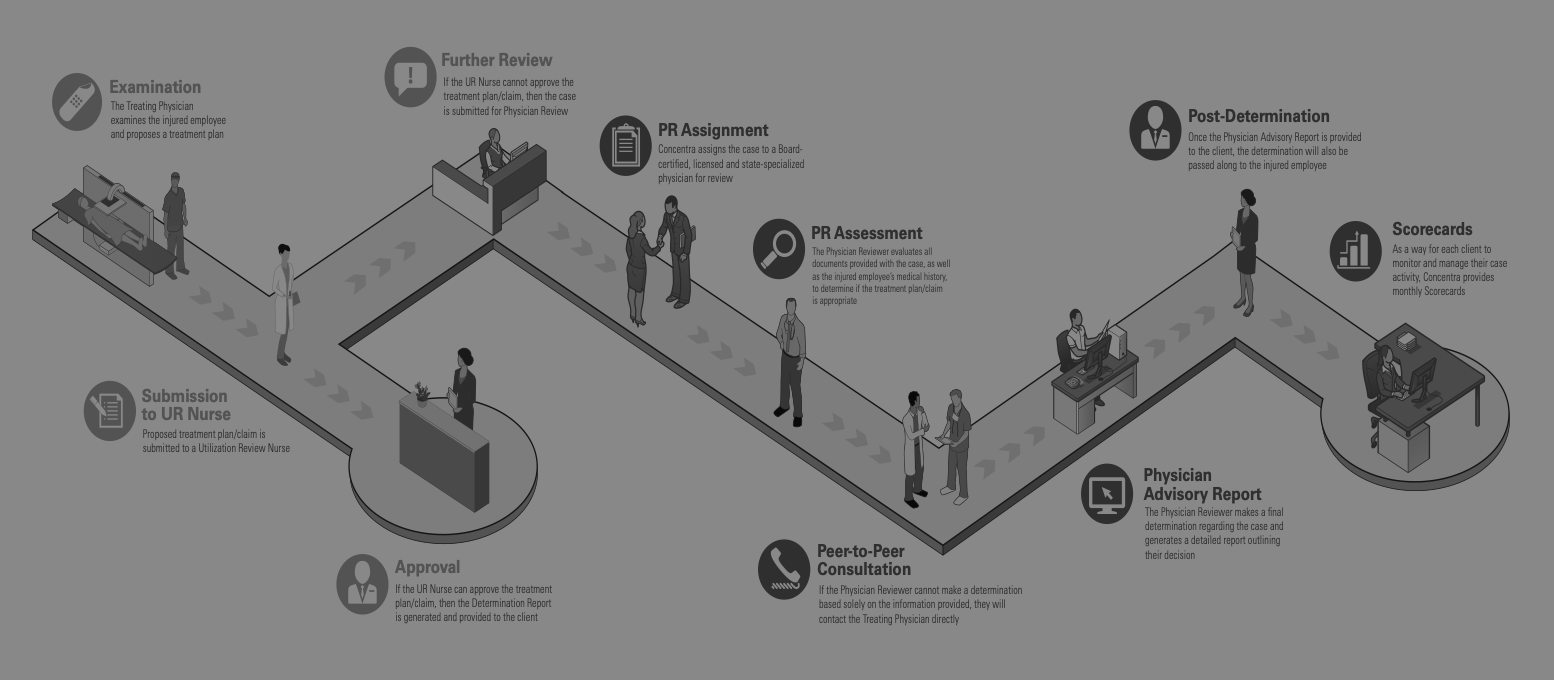
A strong infographic can increase organic traffic to your site and help win over that big potential client. By nature, humans are visual learners, according to Moveable Ink, “visual information travels to the brain 60,000x faster” than any other medium.[1] By knowing the dos and don’ts of infographics you can have more confidence in your marketing strategy.
Whether or not you know a lot about infographics, it’s best to start with the basics. An infographic is a graphic visual representation of information, data, and knowledge intended to present information quickly and clearly. A strong infographic successfully communicates accurate, useful, and meaningful information through visuals to allow the audience to connect with it instantly.
The 5 key takeaways you should know about infographics are:
- Tell an accurate story – Nothing is worse than presenting wrong information, especially when you have your company’s reputation on the line. It should be your goal to become experts in the information you present on your infographics so that you are confident in the work you show your clients. Make sure you conduct thorough research and get your information from credible sources.
- Know your audience – Knowing who your audience is can help you make important decisions. Narrowing down and having a specific target audience can help identify specific language and customs that may place you in a better position to effectively persuade your target audience. This, in turn, will show the viewer that you understand them and know where they are coming from, ultimately making you a more reliable source.
- Show detailed data/information – Data is one of the most important things to have in an infographic, and Weber lives by this strategy. It shows credibility and supports your story. Statistics help the viewer to put things into perspective and if portrayed correctly they are super memorable and impactful. Remember to always keep the data at the forefront and keep your sources close by.
- Use design to help support your information – Think about hierarchy and chronological sequences and how both of these work together. Whether it is showing the relationship of information through time, size, importance, etc., remember, great design should be able to guide the reader’s eyes through the story you are trying to tell. One may also use design to break sections up to cause separation between different sets of information, or to show certain steps within a process; this helps with scan-ability.
- Create eye-catching design – This allows the viewer to understand the information quickly. You never want to use color without purpose or use decoration. Be purposeful with your design thinking and make sure everything has a reason; you never want to have a waste of space.
From our experience at Weber Associates, we know how important these five key takeaways are. We not only implement these when we create our infographics, but we also use them in our everyday business. We have become experts within our field over the years by using this specific design thinking, and it has helped us persuade clients and has helped make our company more memorable.
To learn more about how Weber Associates implements the dos and don’ts of infographics, take a look at The Internet of Things: Anything that can be connected, will be connected.
[1] https://movableink.com/blog/29-incredible-stats-that-prove-the-power-of-visual-marketing
About Weber Associates
Weber Associates is a Columbus, OH-based consulting firm. Since 1985, we have blended the creativity of a marketing agency with the analytical rigor of a consultancy to help our clients solve real sales and marketing challenges so they can significantly grow revenues and customer loyalty.


